No. 51 of 100Finish times
Race fields spread out over the years
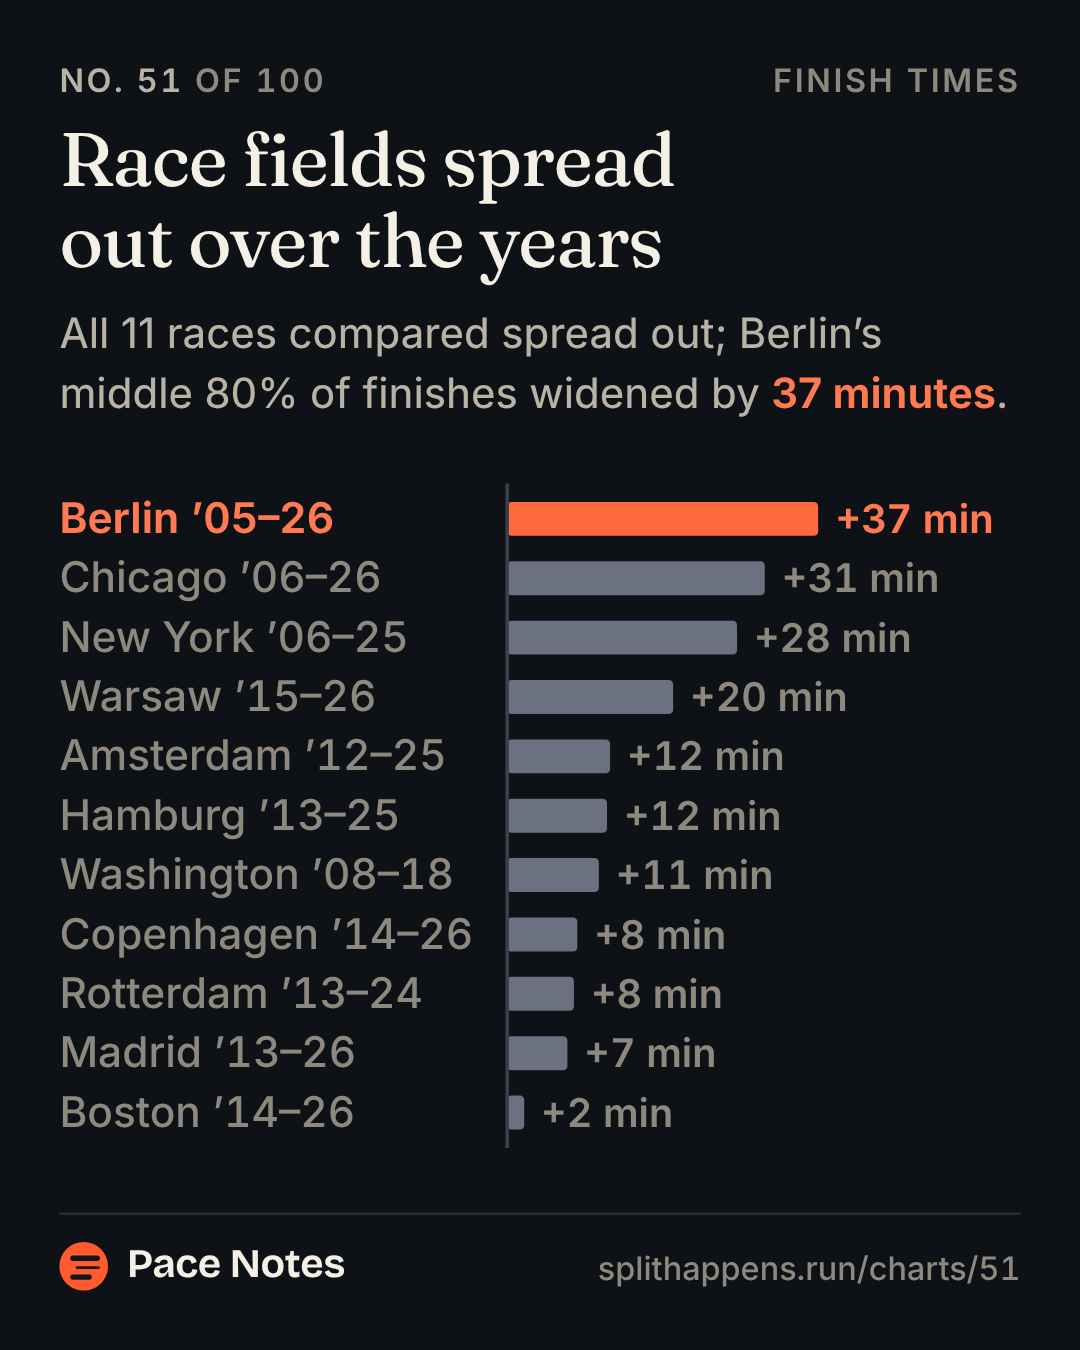
All 11 races compared spread out; Berlin’s middle 80% of finishes widened by 37 minutes.
Pace Notessplithappens.run/charts/51
No. 51 of 100Finish times
All 11 races compared spread out; Berlin’s middle 80% of finishes widened by 37 minutes.
Race fields spread out over the years
| Group | Value |
|---|---|
| Berlin ’05–26 | +37 min |
| Chicago ’06–26 | +31 min |
| New York ’06–25 | +28 min |
| Warsaw ’15–26 | +20 min |
| Amsterdam ’12–25 | +12 min |
| Hamburg ’13–25 | +12 min |
| Washington ’08–18 | +11 min |
| Copenhagen ’14–26 | +8 min |
| Rotterdam ’13–24 | +8 min |
| Madrid ’13–26 | +7 min |
| Boston ’14–26 | +2 min |