Pace NotesThe half marathon
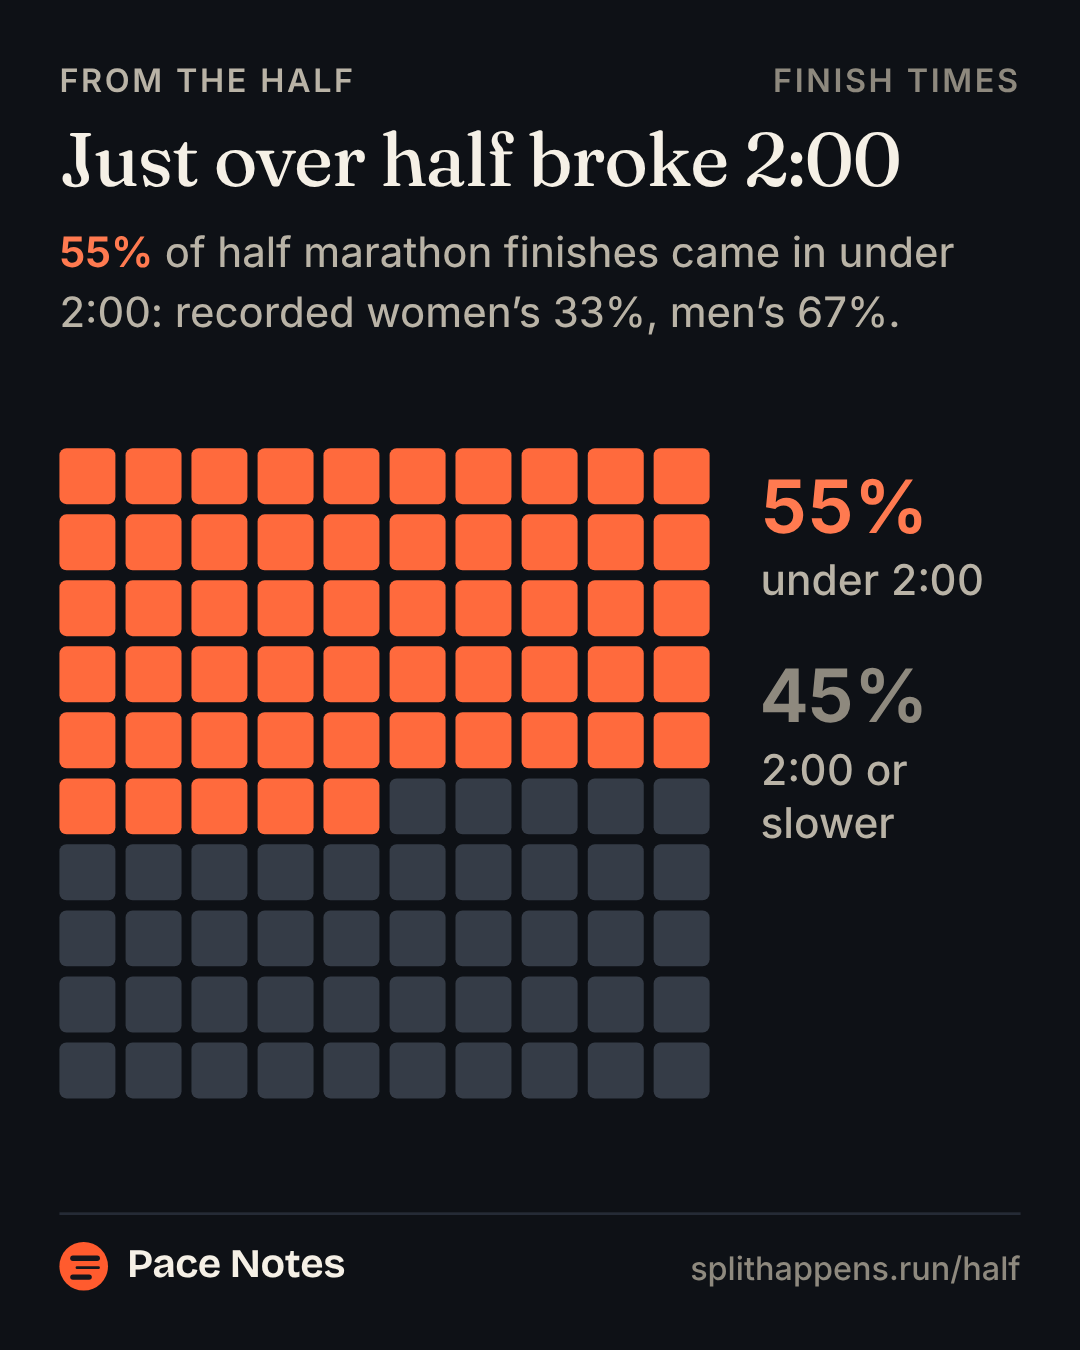
Just over half of half marathon finishes came in under 2:00.
1 hour 57 minutes
the median half finish; recorded women’s 2:08, men’s 1:52
1 in 4 half finishes came in under 1:45.
Slide to any time from 1:15 to 3:00.
The minute before 2:00 held 1.2× the finishes a smooth curve expects.
16,949 finishes came in at 1:59, where the smooth curve expects about 14,000. The minute before 1:30 held 1.2× too; before 1:45, 2:15 and 2:30, about 1.05×.
Women’s share of half and marathon finishes, same city and year.
- Typical24% · 39%
- Oslo22% · 40%
- Berlin26% · 38%
All numbers3 tables
Half finishes under each time: all, recorded women’s and recorded men’s
| Under | All | Women’s | Men’s |
|---|---|---|---|
| 1:15 | 0.5% | 0.1% | 0.7% |
| 1:20 | 1.4% | 0.2% | 2.1% |
| 1:25 | 3.3% | 0.5% | 4.8% |
| 1:30 | 6.7% | 1.2% | 9.8% |
| 1:35 | 11.2% | 2.4% | 16.0% |
| 1:40 | 17.8% | 4.8% | 24.8% |
| 1:45 | 25.8% | 8.8% | 35.0% |
| 1:50 | 34.8% | 14.7% | 45.7% |
| 1:55 | 44.3% | 22.5% | 56.1% |
| 2:00 | 55.2% | 33.4% | 67.0% |
| 2:05 | 63.6% | 43.5% | 74.5% |
| 2:10 | 71.2% | 53.5% | 80.7% |
| 2:15 | 77.8% | 63.0% | 85.7% |
| 2:20 | 83.2% | 71.4% | 89.6% |
| 2:25 | 87.5% | 78.3% | 92.5% |
| 2:30 | 90.9% | 83.9% | 94.7% |
| 2:35 | 93.4% | 88.1% | 96.2% |
| 2:40 | 95.2% | 91.3% | 97.3% |
| 2:45 | 96.6% | 93.8% | 98.1% |
| 2:50 | 97.6% | 95.6% | 98.8% |
| 2:55 | 98.4% | 96.9% | 99.1% |
| 3:00 | 98.9% | 97.8% | 99.5% |
The minute before each round time, against the smooth curve
| Before | × curve | Minute before | Curve | Minute after | 95% interval |
|---|---|---|---|---|---|
| 1:30 | 1.24× | 7,263 | 5,872 | 5,593 | 1.18× to 1.29× |
| 1:45 | 1.05× | 13,937 | 13,312 | 12,951 | 1.02× to 1.07× |
| 2:00 | 1.21× | 16,949 | 13,974 | 13,729 | 1.17× to 1.24× |
| 2:15 | 1.07× | 9,463 | 8,838 | 8,846 | 1.04× to 1.10× |
| 2:30 | 1.04× | 4,702 | 4,532 | 4,241 | 1.00× to 1.07× |
Women’s share of recorded finishes, the same city and year, and the gap within each pair in points
| City | Year | Half | Marathon | Gap, points |
|---|---|---|---|---|
| Berlin | 2015 | 37.1% | 24.3% | +12.8 |
| Berlin | 2016 | 38.6% | 25.7% | +13.0 |
| Berlin | 2017 | 39.6% | 28.2% | +11.4 |
| Oslo | 2016 | 41.9% | 24.2% | +17.8 |
| Oslo | 2017 | 39.0% | 21.4% | +17.6 |
| Oslo | 2018 | 38.7% | 23.0% | +15.7 |
| Oslo | 2023 | 36.8% | 20.0% | +16.8 |
| Oslo | 2024 | 42.9% | 21.2% | +21.7 |
| Oslo | 2025 | 42.4% | 24.5% | +17.8 |