No. 91 of 100Pacing
After 20K, nearly every finish slowed somewhere
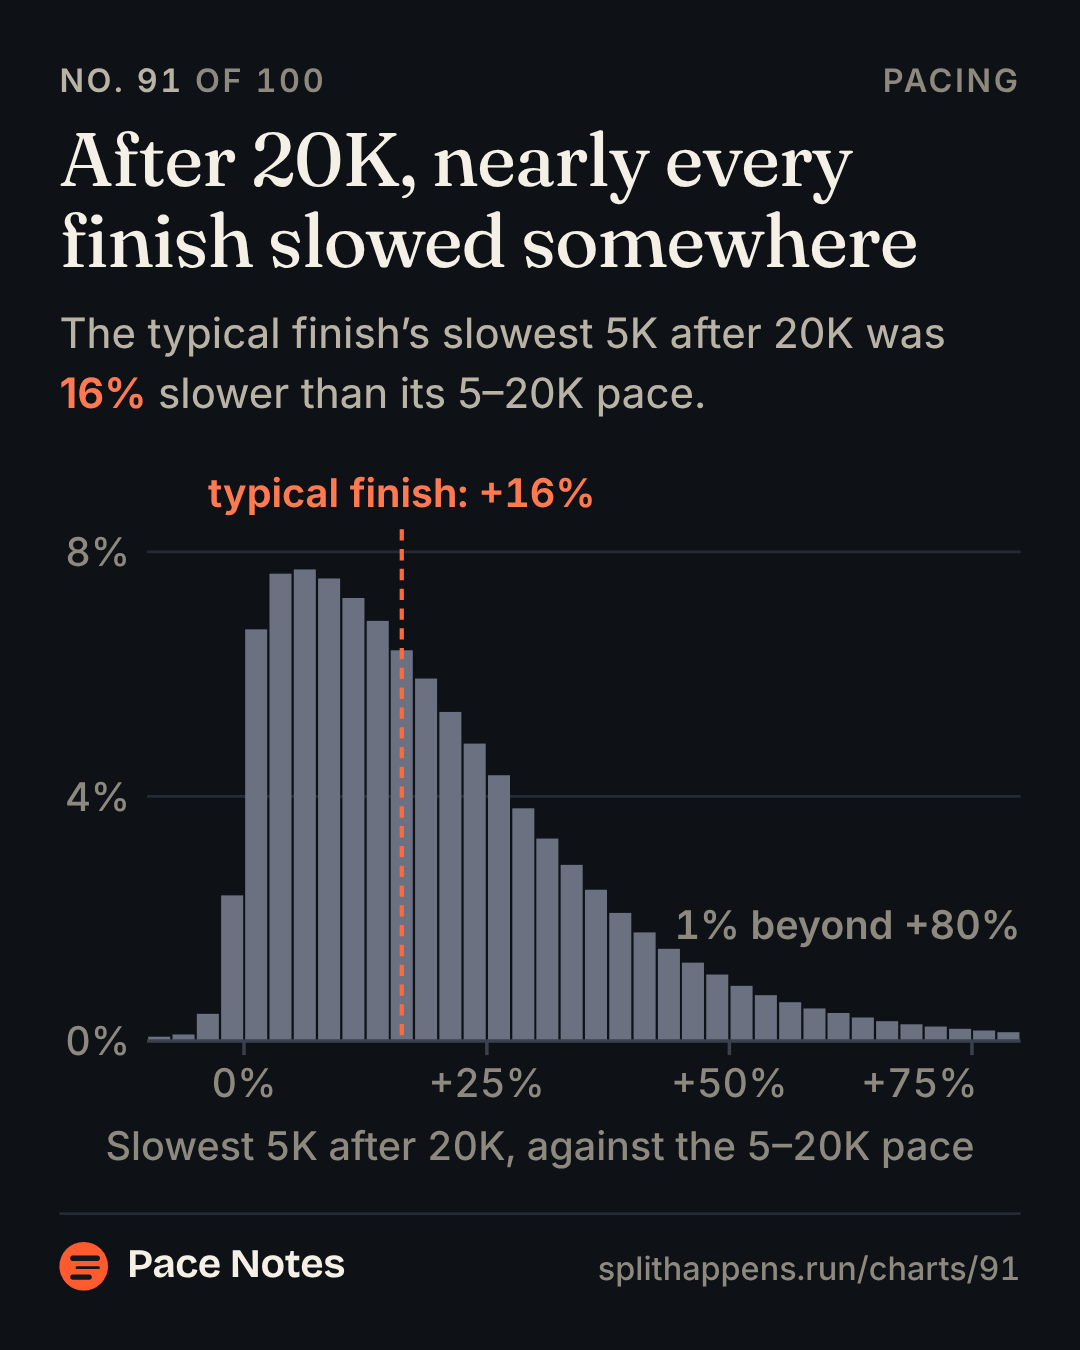
The typical finish’s slowest 5K after 20K was 16% slower than its 5–20K pace.
Pace Notessplithappens.run/charts/91
No. 91 of 100Pacing
The typical finish’s slowest 5K after 20K was 16% slower than its 5–20K pace.
After 20K, nearly every finish slowed somewhere
| From | To | Value |
|---|---|---|
| −10% | −7% | 0% |
| −7% | −5% | 0% |
| −5% | −2% | 0% |
| −2% | 0% | 2% |
| 0% | +3% | 7% |
| +3% | +5% | 8% |
| +5% | +8% | 8% |
| +8% | +10% | 8% |
| +10% | +13% | 7% |
| +13% | +15% | 7% |
| +15% | +18% | 6% |
| +18% | +20% | 6% |
| +20% | +23% | 5% |
| +23% | +25% | 5% |
| +25% | +28% | 4% |
| +28% | +30% | 4% |
| +30% | +33% | 3% |
| +33% | +35% | 3% |
| +35% | +38% | 2% |
| +38% | +40% | 2% |
| +40% | +43% | 2% |
| +43% | +45% | 2% |
| +45% | +48% | 1% |
| +48% | +50% | 1% |
| +50% | +53% | 1% |
| +53% | +55% | 1% |
| +55% | +57% | 1% |
| +57% | +60% | 1% |
| +60% | +63% | 0% |
| +63% | +65% | 0% |
| +65% | +68% | 0% |
| +68% | +70% | 0% |
| +70% | +73% | 0% |
| +73% | +75% | 0% |
| +75% | +78% | 0% |
| +78% | +80% | 0% |