No. 27 of 100Pacing
The slowest 5K usually came at 35–40K
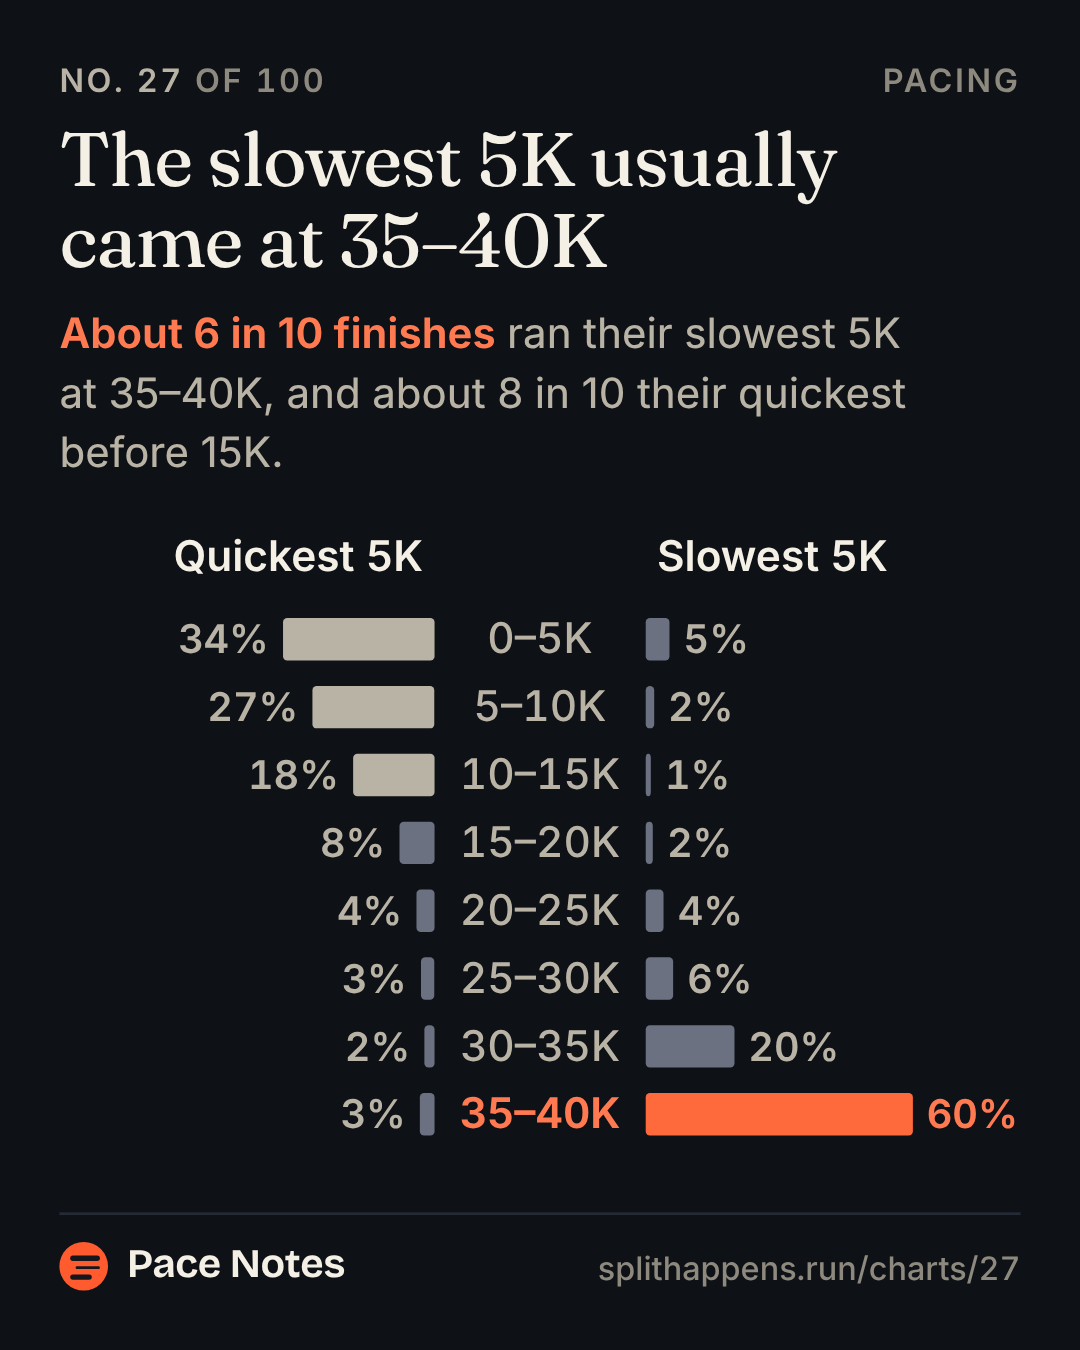
About 6 in 10 finishes ran their slowest 5K at 35–40K, and about 8 in 10 their quickest before 15K.
Pace Notessplithappens.run/charts/27
No. 27 of 100Pacing
About 6 in 10 finishes ran their slowest 5K at 35–40K, and about 8 in 10 their quickest before 15K.
The slowest 5K usually came at 35–40K
| Group | Quickest 5K | Slowest 5K |
|---|---|---|
| 0–5K | 34% | 5% |
| 5–10K | 27% | 2% |
| 10–15K | 18% | 1% |
| 15–20K | 8% | 2% |
| 20–25K | 4% | 4% |
| 25–30K | 3% | 6% |
| 30–35K | 2% | 20% |
| 35–40K | 3% | 60% |